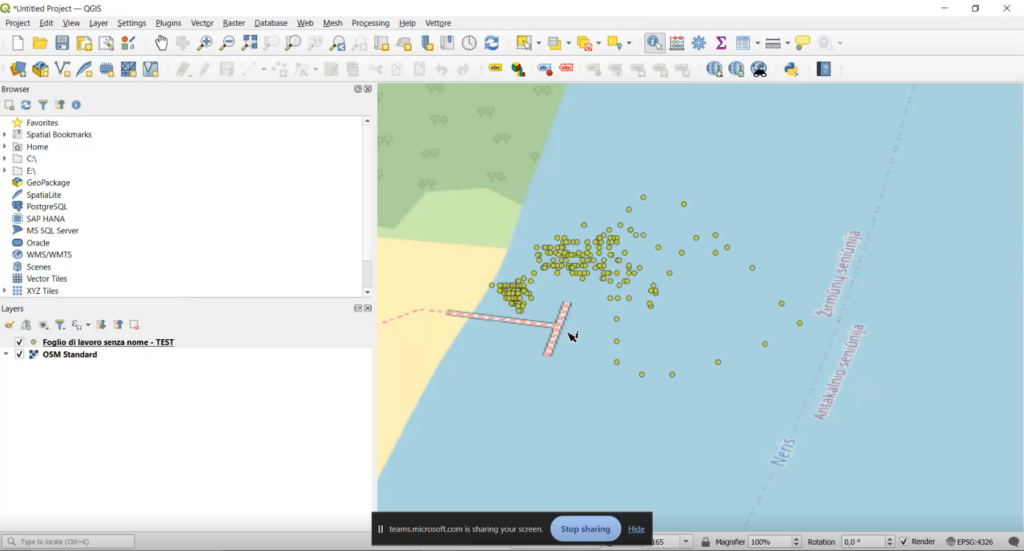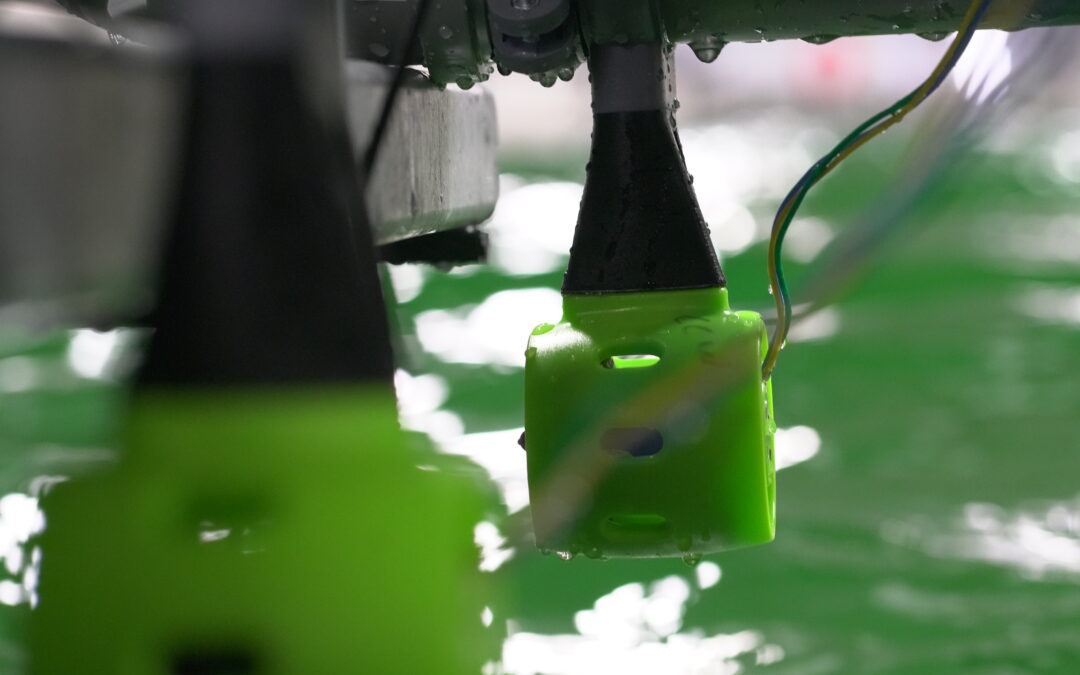
Our project Sailtunities is unique in being one of the first ones to show the usage and tools to do GIS analysis to highschool students. We have shown it even by using data that the students collect themselves, using drone boats that they build during the course with other teachers of theirs.
We offer a course that introduces high school students to the world of geospatial analysis using QGIS, an open-source geographic information system. In this course, students work with real data they’ve collected themselves—using a drone boat—to create maps that reveal meaningful patterns and insights.
What the Course Covers
- Getting Started with QGIS: Learn the basics of the software and how geographic data can be visualized.
- Working with Your Own Data: Import and configure data layers, ensuring accurate representation on maps.
- Visualizing Data: Customize maps using different colors, sizes, and shapes to represent various data values.
- Creating Heat Maps: Use tools to display data density and uncover trends within the collected information.
- Sharing Your Findings: Export maps with annotations and legends to effectively communicate your results.
Why This Course is Valuable
By engaging with their own data, students develop practical skills in data analysis and critical thinking. The course integrates concepts from science, technology, and environmental studies, offering a multidisciplinary learning experience.
This course is ideal for teachers seeking to enhance their curriculum with practical applications of technology, as well as for parents looking for educational opportunities that encourage curiosity and real-world engagement.
Learn More
If you’re interested in how this course can benefit your students or children, contact us for more information. The course materials are provided free of charge, financed by Erasmus+ programme.